Work and Employment
Work is at the center of most people’s lives. For billions of adults around the world, it is the main way to earn a living, support their families, and contribute to society.
What share of the population in different countries is part of the labor force? How is employment split between people who work for an employer and those who run their own business or work independently? And how many people want a job but can’t find one?
On this page, we look at these different aspects of work. We explain the key concepts and present data showing how labor market participation, unemployment, and employment are measured, and how the trends differ across countries.
We focus on paid work among people of working age. Other important aspects, such as unpaid care work, child labor, and long-run trends in working hours, are covered separately.
Understanding labor force statistics: participation, unemployment, and employment
Employment and unemployment figures come up regularly in public discussions, and the terms themselves will be familiar to most of us. But in labor force statistics, these terms have specific meanings, and the exact definitions matter for understanding what the numbers show.
Without a clear grasp of the definitions and who is counted where, it is easy to misread the data — for example, by taking a rise or fall in unemployment to only reflect changes in how many people have jobs, when it can also reflect changes in how many people are counted as looking for work in the first place.
In this section, we walk through this and other common sources of confusion, laying out the key definitions and showing how they shape the interpretation of employment trends.
The labor force: who is included and who is not
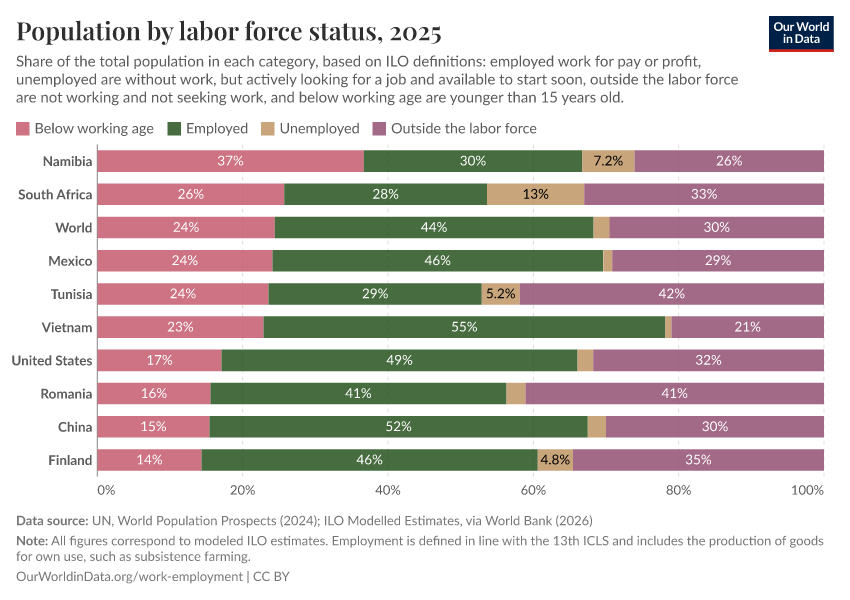
The labor force includes those of working age who are “economically active”, either because they are working or because they are actively looking for work.
The diagram here illustrates this classification. The labor force, shown in purple, includes people of working age who are employed (dark blue) and those who do not have a job but are actively seeking one (light blue).1
The labor force excludes people who are not of working age (dark red), as well as people of working age who are neither employed nor actively seeking work (orange). The orange group “outside the labor force” includes students, retirees, unpaid caregivers, as well as those who are not actively seeking work, perhaps due to long-term illness or other reasons.
How is “working age” defined?
There is no single definition of “working age”. The age range used in labor statistics varies by country and by data source.
The most common lower age limit is 15, but some sources start at 14, 16, or 18, often reflecting national laws on minimum working ages and how labor force surveys are designed. Some sources also set an upper age limit, commonly around 64, reflecting statutory retirement ages or pension eligibility rules; but since these vary (and can change over time), the exact cutoff is not the same across countries or even within a country over time.
For international comparisons, the most widely used cross-country series are produced by the International Labour Organization (ILO). In its harmonized series, the working-age population is typically defined as everyone aged 15 and older, with no upper age limit, and most of our charts on this page follow this definition.2
How labor force surveys measure who is working and who is not
In most countries, headline labor statistics are produced using dedicated labor force surveys (LFS). In these surveys, national statistical offices ask people of working age about their work situation: more specifically, what they have been doing for work recently and, if they don’t work, whether they were looking for a job.3 Where dedicated labor force surveys don’t exist, countries sometimes use other household surveys or population censuses that ask related questions about work.4
Labor force surveys focus on people’s recent work situation. The definition of “recent” is fixed using a clearly defined window of time, typically the past week. This observation window is called the reference period.
Based on the survey responses, statistical offices classify everyone of working age into one of three categories:
- A person is counted as employed if they did any work for pay or profit during the reference period. This definition is broad: even one hour of paid work counts, as does self-employment or helping without pay in a family farm or family business. It can also include work to produce goods for one’s own use, such as subsistence farming (depending on the statistical standards).5 But unpaid activities done in the household for the own benefit of the family, such as cooking, cleaning, or caring for family members, are not counted as employment.
- A person is counted as unemployed if they did not have a job during the reference period, but were actively looking for one (for example, by applying for jobs or contacting employers) and were available to start soon.
- People who were not working, not actively searching for a job, or not available to start soon are considered to be outside the labor force. As mentioned above, this includes groups such as college students, retired people, or caregivers.
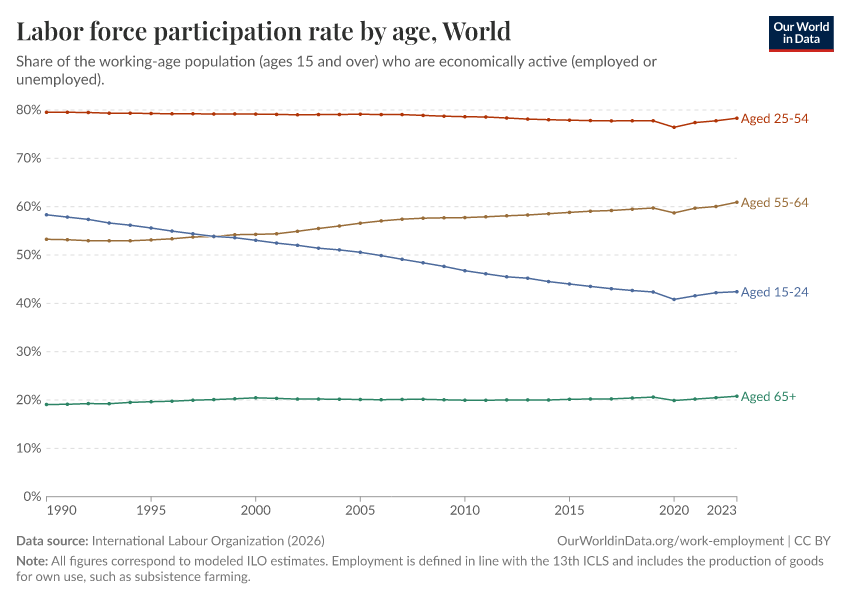
Key indicator: the labor force participation rate
One metric that is commonly discussed is the labor force participation rate. This indicator measures the share of the working-age population that is either employed or unemployed, based on the classification explained above.
It answers a basic but important question: out of all the adults of working age, how many are actually taking part in the labor market?
The map shows labor force participation rates around the world. As we can see, there are large differences across countries — in some countries, more than 70% of adults are working or looking for work, while in others, fewer than half are active in the labor market.6

The differences in labor force participation across countries often reflect demographic differences, because work follows life-course patterns: more people in education at younger ages, more people retired and not in the labor force at older ages.
They also reflect social norms and policies that shape who works and who doesn’t. In particular, in many countries, women are much more likely than men to be out of the labor force, often because they spend more time on unpaid care and housework; and female labor participation rates also vary with education systems, pension rules, and the availability of childcare. You can read more about this on our page on Women’s Employment.

Key indicator: the unemployment rate
It is common to think of the unemployment rate as the share of adults who are out of work. In labor force statistics, however, it has a more specific meaning. The unemployment rate measures the share of people in the labor force who do not have a job, and are both actively looking for work and available to start soon.
It gives a simple indication of how difficult it is for people who want a job to find one, which is why it is widely followed in public discussions and policy debates.
The next map plots unemployment rates across the world. The data shows that in recent years, most countries have had unemployment rates in the range of around 2% to 10%. This pattern holds for countries of very different income levels.
This is something that often surprises people: some poor countries have similar or even lower unemployment rates than rich countries. For example, Burkina Faso and Australia have roughly the same unemployment rate (around 3.5% and 4 % in 2025).
This pattern is explained by the fact that, despite the levels being similar, the underlying dynamics and work patterns are very different. In poorer countries, most people work in informal or subsistence activities, even when the work is irregular, because they cannot afford to be unemployed (or outside the labor force) for long. In richer countries, a much larger share of workers are in formal wage employment, and unemployment more often reflects job loss and active job search within a formal labor market. We explain this distinction between formal and informal employment and explore the cross-country pattern in more detail in the section below.

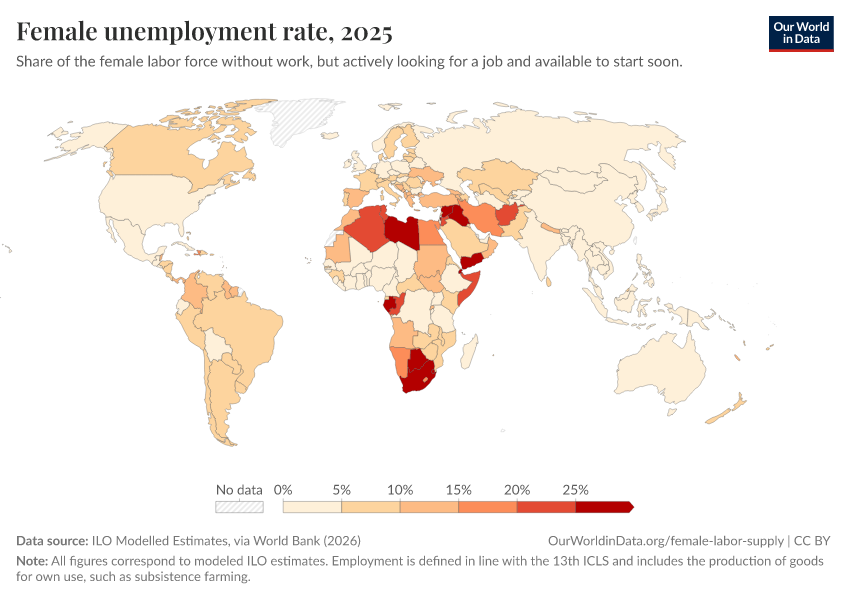
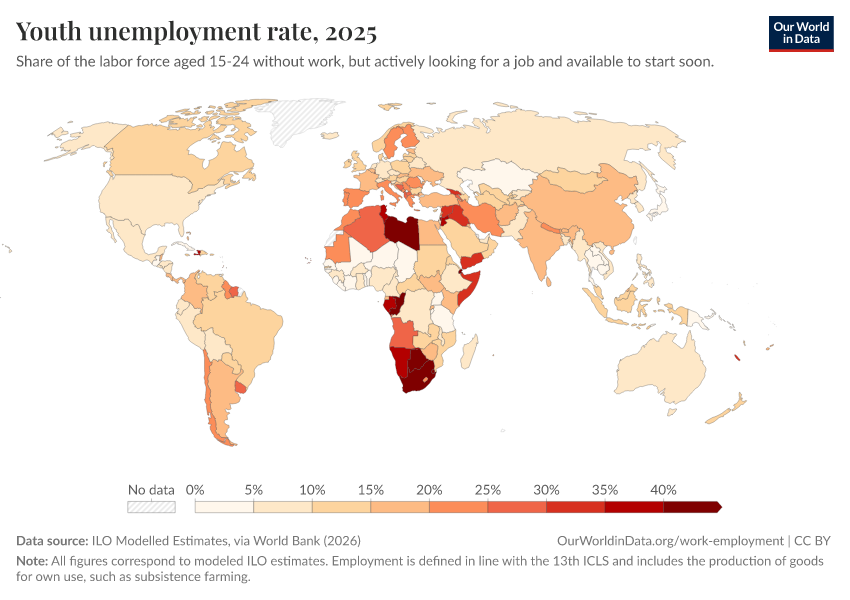
In the map, we focus on overall unemployment rates, but the picture can look very different for specific groups. In many countries, women have higher unemployment rates, and young people are more likely to be unemployed.
What the unemployment rate measures, and what it misses
As we explained above, the concept of “unemployment” has a specific meaning in official statistics. A person is counted as unemployed if they had no work during the reference period, have recently taken active steps to find work, and are available to start work soon. Current ILO guidance operationalises this with a “recent” search window of four weeks, and a “short availability” window of two weeks.7
Because the definition depends on a specific reference period, which covers a relatively short window, the timing and frequency of the surveys are crucial. Seasonal workers, for example, may be classified as employed or unemployed depending on when the survey takes place.
As a result, unemployment rates can vary depending on the time of year and the frequency of surveys. It can be quite different if we look at monthly, quarterly, or annual data.8
Job-search behaviour is another factor that shapes both the measurement and interpretation of unemployment figures. “Actively looking” for work requires concrete steps — for example, applying for jobs, registering with employment services, answering adverts, contacting employers, or taking steps to start a business. In essence, the requirement to be “actively looking” sets a higher bar for what counts as a job-search effort and goes beyond just wanting a job.9
People who want to work but have stopped searching because prospects are poor, previous searches failed, costs or caring responsibilities limit their options, or they lack confidence that a costly job search will pay off, become “discouraged workers”. Because they are not actively searching, they are not counted as unemployed and are instead recorded as outside the labor force.
This helps explain why, especially during economic downturns, unemployment numbers can understate joblessness: when people stop looking for work, they move outside the labor force, and the unemployment rate can fall even though employment has not risen.
Understanding this point clarifies what the unemployment rate actually measures: not the share of all adults without work, but the share of people in the labor force — those actively engaged in the job market — who are unemployed.
Key Indicator: the employment rate
Another way to understand activity in the labor market is to look at how many adults actually have jobs. This is what the employment rate (also known as the employment-to-population ratio) captures.
While the unemployment rate tells us how many people in the labor force are without a job, this indicator looks at the entire working-age population. It answers a question that many people intuitively care about: among those who could work (because they are of working age), how many are employed?
This indicator complements the unemployment rate by using a broader reference group. It therefore reflects both differences in employment and differences in labor market participation.
Because of this, the two indicators are related, but they tell different stories: countries with low unemployment rates often have higher employment rates, but this is not always the case.
Consider, for instance, Italy. In 2025, Italy had one of the lowest employment rates in Europe, at around 46%, while its unemployment rate was not far from the European Union average.
This reflects the fact that a larger share of older people and women in Italy are outside the labor force. Lower participation reduces the employment rate but does not affect the unemployment rate, since people who are not actively looking for work are not counted as unemployed.10

How people work: employment relationships and job types
Employment statistics try to answer a simple question: how many people work? The answer to this question, clearly, depends on what we mean by “work”.
In practice, what constitutes “having a job” or “being employed” can mean very different things. Some people work for an employer, others run their own company, and some work without pay in a family business or farm. Some work long hours every day, others only for a few hours a week.
In official statistics, all of these people are considered employed. Under the ILO framework, anyone who worked for pay or profit for at least one hour during the survey reference period (usually a week) is considered employed.11
Because employment takes many forms, it is useful to look not only at how many people work, but also how they work.
Employment status
One way to classify workers is by their employment status. In this context, “status” describes the nature of a person’s employment relationship, that is, who they work for or with. It’s not about the sector they work in, their skill level, or the quality of their work.
Here, the focus is on whether people work for others, for themselves, or within a family business or family farm.
The ILO distinguishes four main categories:
- Employees — people who work for an employer in exchange for wages or a salary.12
- Employers — self-employed people who run their own business and hire other people as staff.
- Independent own-account workers — self-employed people who don’t hire others. For example, in low-income countries, this often includes small farmers, informal street vendors, and people running one-person businesses from home. In high-income countries, this includes freelancers, consultants, and solo tradespeople, such as plumbers or electricians.13
- Contributing family workers — people who work without pay in a family business or farm, including those producing goods either for sale or for their own use.14
The chart here shows how workers are distributed across these groups. You can add or remove countries.
The main insight from this chart is that in poorer countries, many people work on their own, often as small farmers, solo traders, or in small family businesses. Much of this self-employment is a way for people to earn a living when stable wage jobs are scarce, rather than running a business by choice. In contrast, in richer countries, most people work as employees (for an employer).15
Understanding these differences in employment status is important for interpreting labor markets and for comparing countries. Headline indicators like the employment rate group all employed people together, but this gives an incomplete picture because employment relationships shape the risks, protections, and opportunities people face at work.

Note that this classification of workers by status doesn’t distinguish between full-time and part-time jobs, between secure and precarious contracts (such as temporary or unstable jobs), or between formal and informal employment.
We’ll come back to informal work in the next section, but here we want to briefly mention another related concept: vulnerable employment. The ILO defines this group as the sum of “independent own account workers” and “contributing family workers.” These are workers who tend to face more job insecurity and irregular incomes. But even within this category, people’s work circumstances can look very different. For example, some own-account workers in rich countries are highly paid professionals or freelancers who have autonomy over their work and stability — people who wouldn’t usually be described as “vulnerable”.
Informal work
When we think about employment, we often picture people in regular, registered jobs — those with written contracts, stable pay, and access to benefits. But a large share of work around the world happens outside this formal framework. These jobs are considered informal.
In official statistics, both formal and informal jobs are included when counting total employment. The ILO framework first classifies people as employed, unemployed, or outside the labor force, and only then, within the employed group, distinguishes between formal and informal employment.
Informality is about the job, not the worker. In general, informal work lacks formal arrangements, either in law or in practice. These jobs are often not covered by labor laws, social security, or worker protections such as sick pay and annual leave. They may also lack written contracts.
Common examples include street vendors, domestic cleaners or caregivers, casual construction workers, small-scale farmers, and home-based craft workers.
But informal employment is not the same as working in the informal sector. A person in a registered, “formal” company can still have an informal job if it lacks legal or social protection.
A concrete example of informal employment
While most of us can probably picture some types of informal employment, others are harder to imagine if you have never seen or experienced them. To make the concept more concrete, it can be helpful to look at a specific real-world example from a non-rich country where many of these jobs exist, and compare how these would be classified in richer countries.
Imagine a busy intersection in Bogotá, Colombia. At the traffic lights, a man approaches cars with a small bucket and cloth, offering to clean windshields in exchange for a few coins. There is no fixed price, no clear expectation, and no guarantee that anyone will pay him. But he shows up at the same intersection every day, often for many hours, because this is how he earns a living. Some drivers give him small coins when they choose to, but on slow days, he earns very little.
In a labor force survey, he would probably report that he “worked for pay or profit for at least one hour during the reference week”, which meets the ILO definition of employment, and he would not report that he is actively searching for a job. He works on his own, brings his own materials, is not paid by an employer, and expects to earn income directly from the activity. By the standards used in labor statistics, he therefore fits squarely within the employed category, specifically as an independent own-account worker.
This may seem surprising because, while cleaning windshields is work, this arrangement doesn’t look like “having a job,” even though it meets the statistical definition of employment.
In many non-rich countries, millions of people make their living through irregular, low-paid, and highly precarious activities like the one in this example. These jobs are part of what labor statistics typically consider informal employment.
In high-income countries, labor statistics rely on the same broad ILO definitions, so the exact same situation would be classified in the same way. The difference is that situations like this are much less common. People who lack a formal job are more likely to receive social assistance or temporary support, including unemployment benefits or subsidies, while they search for work. As a result, marginal income-earning activities are more often short-term stopgaps rather than a main livelihood.
Informal employment does exist in richer countries, but it often looks quite different. In high-income countries, it often takes the form of undeclared pay, misclassification, or atypical contracts, rather than visible and highly precarious own-account work, as in the example. The same statistical category of informality can therefore capture very different realities across countries.
Measuring informal employment
Measuring informality is difficult, and definitions vary across countries. National statistical offices often rely on a mix of criteria, such as whether a worker has a written contract, access to social security, or employment benefits. However, countries differ in which of these criteria they apply, so estimates are not always comparable.16
Informal jobs can also be hard to capture in surveys, because people may not be willing to report these jobs in the first place. Workers might worry about tax implications or other consequences of declaring informal activity.
These difficulties are reflected in the data itself: cross-country estimates of informal work are incomplete, with informal employment not measured separately in many high-income countries such as the US, Canada or the UK, where open informality is less visible.17
Despite these limitations, the available data provide a useful picture of how widespread informal employment remains around the world. As the chart shows, informal work is an essential source of income for many people. In the Democratic Republic of Congo, for example, nearly 97% of the people who work do so in an informal job. Some of these workers are employees paid by an employer in an informal setting, but that’s a minority — the majority are independent “own account workers” or “contributing family workers”.

Informal work is far more prevalent in lower-income countries, where it often serves as the main source of income for workers and their families. But in richer countries, as mentioned above, there is also informal employment — for example, in undeclared domestic work or delivery jobs without contracts or benefits.
Reducing informality and extending legal and social protection to all workers is one of the targets of the Sustainable Development Goals (SDG 8).
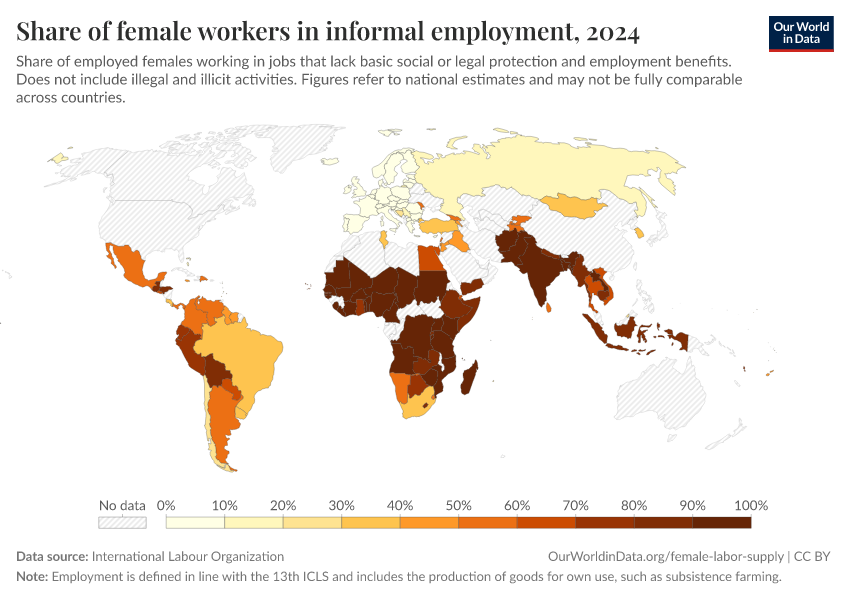
Share of female workers in informal employment
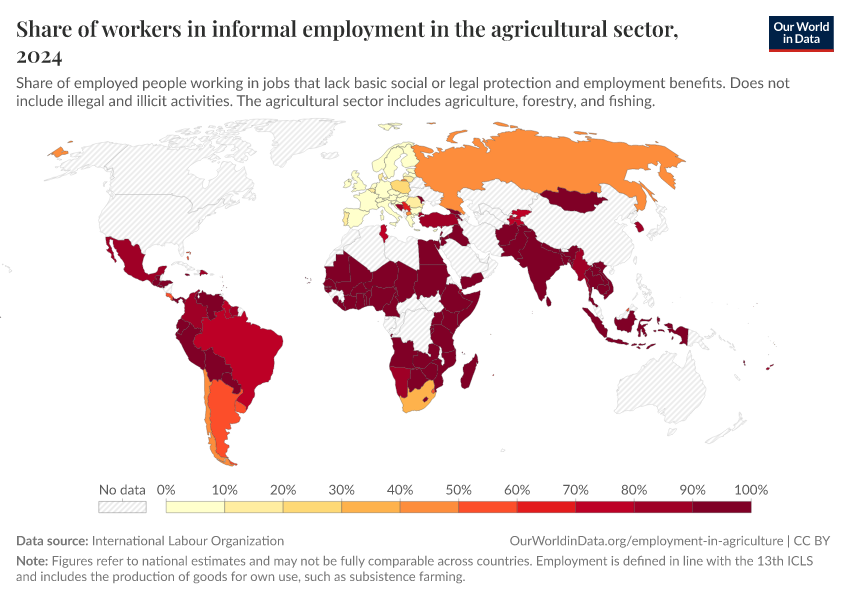
Share of workers in informal employment in the agricultural sector
Share of employed people working in jobs that lack basic social or legal protection and employment benefits. Does not include illegal and illicit activities. The agricultural sector includes agriculture, forestry, and fishing.
Employment by economic sector
In the previous sections, we looked at employment from two angles: who is counted in the labor force, and their working arrangements. Here, we look at the data from a different perspective. Instead of focusing on who people work for, we focus on what work they do in the economy.
A common way to do this is to classify jobs by broad sectors of activity, such as agriculture, industry, and services. These categories describe the main activity of the workplace, not the specific tasks an individual performs.
Looking at employment by economic sector helps understand how employment patterns change as countries develop. As incomes rise, workers tend to move out from agriculture into industry and then into services — a shift often referred to as “structural transformation”.
The chart here shows this. In lower-income countries, a large share of workers are employed in agriculture (often as independent own-account or informal workers, as shown in the previous charts). In richer countries, by contrast, most employment is in services, reflecting jobs that are more likely to be wage-based and formal. This mirrors the differences above in employment status and informality: structural change in the sectoral composition of jobs often goes together with a shift away from independent and subsistence work toward wage employment.
But it is important not to assume that “moving out of agriculture” is equivalent to “moving into formality”. Many middle-income countries have a sectoral mix that is closer to rich countries than to poor ones, yet informality remains widespread. Colombia is a good example of this — industry and services make up more than 85 percent of employment, but close to 60 percent of workers remain in informal employment.

Data quality and measurement
International labor statistics are incomplete and uneven
Comprehensive labor force survey data isn’t always available. In many countries, national labor statistics are patchy or missing entirely for some years. And even when data does exist, it can be noisy or inconsistent with international measurement standards. These are the two main reasons why the International Labour Organization (ILO) produces modeled estimates.
To produce modeled estimates, the ILO applies a shared harmonization standard (currently the 13th ICLS), adjusts reported data to improve comparability, and uses statistical models to estimate missing values (we explain this in more detail below).
The map here gives you an overview of the coverage of the ILO’s unemployment rate estimates across countries and time. It distinguishes between years where both national survey values and modeled estimates exist (and whether these estimates agree), and those where only one or neither is available.18

As the map shows, coverage is uneven across countries and over time. Using the slider, you can see how this has changed. With improvements in data collection, most high-income countries, and many middle-income countries, now report national survey unemployment estimates on an annual basis, and these tend to closely match the ILO’s modeled figures.
India illustrates how changes in data collection can expand coverage. In 2017, the country introduced a new annual labor force survey (the Periodic Labour Force Survey, PLFS), replacing an earlier survey that was conducted roughly every five years.
In contrast, large parts of Africa and Asia still lack regular, representative labor force surveys, which means unemployment estimates for many years rely primarily on ILO modeling.19
How does the ILO produce “modeled estimates” of labor statistics?
The ILO’s goal is to create a comprehensive dataset covering every country and year, allowing for cross-country comparisons and the calculation of regional and global aggregates based on a single measurement standard.
Before modeling begins, the ILO collects the data that already exists. This typically starts with labor force survey microdata — the anonymized individual responses — when countries make them available. Where labor surveys are missing, the ILO may rely on alternative sources, such as household surveys or, more rarely, population censuses.
Once the existing data is triaged and harmonized, the ILO identifies remaining gaps and uses statistical models to estimate missing values for specific countries or years. These models draw on data from the same country at other points in time (interpolation), as well as from similar countries, such as those that are geographically close or at similar income levels
The models also relate labor market indicators to other variables, such as GDP, population, demographic structure, and education, using data from sources including the UN, World Bank, and IMF. The outputs of these models are the ILO “modeled estimates.”
The ILO provides a high-level description of this approach, but there is no detailed public documentation or code that specifies the exact model structure, variables used, or how different inputs are weighted. They only provide a general overview, which you can read here.20
How do “modeled estimates” compare to national data as reported by countries?
The data visualization here compares unemployment rates from national estimates (as reported by countries) and modeled estimates (as produced by the ILO).
You can use the dropdown menu to select a different metric: labor force participation rates and employment rates.
When labor force surveys are regular and reliable, modeled estimates are identical or very close to the national estimates. But where surveys are sparse — often in poorer countries or those affected by crises — the modeled results rely more heavily on statistical assumptions, and there are substantial differences between the national and modeled estimates.
In some countries, such as Mali and Rwanda, for instance, you can see that better data coverage, harmonized definitions, and improved ILO models have brought the two series closer together in recent years. Looking further back in time, however, this convergence is much less common. In earlier years, differences between national and modeled estimates were often much larger, especially across sub-Saharan Africa and parts of Asia.
The modeled estimates remain the most comprehensive and comparable source for making global and regional comparisons of labor statistics, but it is important to emphasize that they should be interpreted with care when analyzing individual countries' trends in isolation or when ranking countries directly.
Notice, in particular, that the ILO approach assumes that labor markets follow predictable patterns that can be captured by broader regional or economic trends, which may not always be true. The ILO models also sometimes smooth out irregular jumps in the data, treating them as possible “measurement noise” rather than genuine shocks. However, in some cases — such as during a crisis or conflict — sharp movements may be genuine.
What you need to know when using work and employment data from the ILO
Where does data on work and employment come from?
Most national data on work and employment comes from national labor force surveys. These surveys ask people of working age about their current or recent work situation, such as whether they have a job, are looking for one, and what kind of work they do.
Labor force surveys are the main data source of this kind of information. But when they aren’t available, researchers try to fill gaps by using other sources, such as general household surveys that include questions about work or, more rarely, population censuses that collect basic data on employment.
The International Labour Organization (ILO) acts as a global hub for this data, compiling and harmonizing results reported by individual countries.
How do international standards make labor data more comparable?
International labor statistics typically follow a set of standards agreed upon at the International Conference of Labour Statisticians (ICLS) — a meeting organized by the ILO roughly every five years.
These ICLS standards set out internationally agreed definitions relating to core concepts, measurement rules, and methodologies. According to the ILO, they reflect expert consensus as “best practices” and provide a shared language for measuring and monitoring the functioning of labor markets around the world.
However, labor markets evolve over time. People do different kinds of work today than they did in the past, employment relations evolve, and statistical definitions are updated to better reflect new realities. As a result, ICLS standards are not fixed — they are revised and refined.
National statistical agencies that run labor force surveys are encouraged to design and report their data in line with ICLS standards.
But countries adopt standards at different speeds, so data from different sources — or even for the same country in different years — may be based on different sets of standards, and are not always directly comparable. When comparing any labor market statistics across countries and over time, it is important to check which definitions and ICLS standards (if any) are being used.
How does the ILO harmonize data across countries?
Most estimates published by the ILO are harmonized to one of the standards agreed at the International Conference of Labour Statisticians (ICLS). For example, both the ILO-published Labor Force Statistics and Modelled Estimates series follow the definitions from the 13th ICLS.
Ideally, to compare data across countries, we should ensure that the data is based on the same set of standards.
When a country’s definition of an indicator differs from the chosen standards (for example, if a country reports estimates based on the 19th ICLS and another follows the 13th ICLS), the ILO reclassifies or adjusts the country-reported figures to match their chosen classification.22 This process relies on the assumption that survey responses can be reclassified in a consistent way, which sometimes is straightforward but other times may not hold well in practice.
Even when countries use the same ICLS standards, surveys can differ in some details — such as what the exact thresholds used to define “working age” are. The ILO takes extra steps to harmonize these, when possible, and this is done for the dataset of modeled estimates.
Why do figures differ between data sources?
It is not unusual for different data sources to report different labor statistics, even when they refer to the same indicator for the same country and year.
One reason for this is that data sources use different definitions. Some figures come directly from countries’ own surveys, while others — such as the modeled estimates published by the ILO — use harmonized definitions or adjust the data to make it more comparable across countries and over time. Even when figures are based on similar labor force surveys, the numbers can differ. This can happen, for example, when countries adopt new international standards — such as moving from the 13th ICLS to the 19th ICLS — or when different age thresholds are used to define the working-age population. As a result, the labor force survey figures published by countries can vary over time, depending on which specific definitions are used, and are also not always identical to the ILO’s harmonized estimates.
Another common reason is that estimates might come from different types of data sources. On this page, we primarily show figures based on labor force surveys, which are the main source used for international comparisons, but some countries also report figures based on administrative data.
A good example of this is the unemployment rate. Some governments publish figures on “registered unemployment", which is based on data from administrative records from job centers or benefit agencies.23 Registered unemployment typically includes people who are eligible for benefits and who choose (or are required) to register. For this reason, it usually underestimates unemployment compared to survey-based measures such as those following the ILO definitions. But the rules of eligibility and registration can vary a lot across countries — for example, by things such as previous work history, length of unemployment, and job search requirements. These rules can vary widely and make it difficult to compare across countries.
When figures come from different sources, their overlap with ILO-based estimates is often only partial. In unemployment statistics, for example, some people recorded as unemployed in administrative registers do not meet the ILO definition, while others who meet the ILO definition never appear in the registers at all. These differences are well documented in countries such as Germany: someone who works up to 15 hours per week can be counted as unemployed in administrative statistics, but under ILO definitions, this person is classified as employed.
Acknowledgments
We thank Hannah Ritchie, Edouard Mathieu, and Andy Dickerson for their helpful suggestions and ideas for this page.
Featured Data on Work & Employment
Data Insights on Work & Employment
Endnotes
“Actively seeking” work means taking concrete steps to find a job, such as applying for jobs or contacting employers, rather than only wanting to work. You can read more about this in this other section.
Including older age groups doesn’t mean they are expected to work. It reflects a descriptive goal: to capture everyone who may participate in the labor market and who, in many countries, does. People above retirement age who are not working or looking for a job are still counted as outside the labor force. The European Union’s Eurostat, for example, has labor statistics for people aged 15 to 89, and publishes indicators for multiple age ranges within this bracket.
The fact that work statistics are produced from data coming from surveys may seem surprising, since it can feel more natural to obtain the relevant information from employers or administrative records. In practice, such records (when they exist) only cover part of the labor market — usually waged, formally registered jobs — and they can differ widely in how jobs are defined and recorded between countries. For this reason, headline national labor statistics and ILO estimates are based on surveys that ask people directly about their work, using common definitions across countries.
A limitation of labor force surveys is that they do not capture all population groups equally well, which can affect how representative labor market statistics are. In particular, migrant and minority groups are often identified using self-reported information. Some respondents may choose not to disclose this information, making labor market outcomes for these groups harder to measure. In some cases, population censuses or other household surveys can help fill gaps, but these sources are typically less frequent or less detailed than labor force surveys. In contexts where migrants face threats, legal uncertainty, or enforcement crackdowns, they may be less willing to respond or disclose information, and this can lead to substantial data gaps.
The exact definition of employment follows international standards that are set by the International Conference of Labour Statisticians (ICLS), and which have changed over time. We explain this further in How do international standards make labor data comparable?
The most used standards today are the 13th ICLS and 19th ICLS. One important difference lies in how they define employment, particularly in how they classify the production of goods for one's own use or consumption, such as subsistence farming. This was included as employment under the 13th ICLS, but not under the newer 19th ICLS, which differentiates between the concepts of “work for pay or profit” and other types of work (which can be unpaid or for one's own use).
People not in the labor force are also described as not economically active, or inactive. The inactivity rate can be calculated as 100 minus the labor force participation rate.
These reference periods are specified in the 19th ICLS. Earlier standards, such as the 13th ICLS, required a reference period but were less prescriptive about its length. You can read more about the differences in standards in our section below.
For annual data, these timing effects tend to cancel out in the annual average (for example, taking the mean of monthly rates), so annual series are typically less affected by seasonal volatility than monthly or quarterly series.
Nevertheless, it’s important to keep in mind that, because unemployment statistics are a snapshot that relies on short reference periods, headline unemployment figures by themselves do not distinguish short-term from long-term unemployment (commonly defined as lasting 12 months or more), nor do they show flows into and out of unemployment. To study duration or transitions, we need survey questions about spell length or panel data that follow the same individuals over time.
Eurostat publishes long-term unemployment data here, and you can read more about it in these references:
Machin, S. and Manning, A. (1999). The causes and consequences of longterm unemployment in Europe. Handbook of labor economics, vol 3, pp.3085-3139.
Krueger, A.B., Cramer, J. and Cho, D. (2014). Are the long-term unemployed on the margins of the labor market?. Brookings papers on economic activity, 2014(1), pp.229-299.
Duell, N., Thurau, L. and Vetter, T. (2016). Long-term unemployment in the EU: Trends and policies. Gütersloh: Bertelsmann Stiftung.
Countries differ in which job-search activities they count and in how questions are worded; those differences can affect reported unemployment. International standards and guidance from the ILO aim to harmonise definitions and survey practice to reduce these comparability issues, but some measurement differences remain.
Another important point to keep in mind when looking at employment rates is that this metric doesn’t capture people who are employed but working fewer hours than they would like (also known as time-related underemployment). The ILO refers to this and other situations, such as the potential labor force, as “labor underutilization”. You can read more about it on the ILO website.
Employment is defined by the ILO according to international standards, which we explain in a section below. Earlier standards (13th ICLS) also counted some unpaid production of goods for own use (such as subsistence farming) as employment. Newer standards (19th ICLS) separate this from employment for pay or profit.
Economists and statistical agencies often distinguish between wages and salaries. Wages are payments linked to a specific unit of time or output, such as per hour or per task, while salaries are regular fixed payments, usually set by an employment contract and paid monthly or annually.
In everyday language, many own-account workers are described as “independent workers” or “independent contractors”. In the ILO framework, however, the category “own-account workers” refers specifically to self-employed people who do not hire others; national legal definitions of “independent contractor” may differ.
In estimates based on the 13th ICLS standards, production for own use (such as subsistence farming) was counted as employment. The 19th ICLS revised this definition: own-use production is no longer included, and only contributing family workers who produce goods for the market or exchange are considered.
One caveat is that employment categories are not perfectly comparable across countries. Some high-income countries classify people who run incorporated businesses as employees rather than self-employed.
Comparability issues can also arise from the different criteria used to define the size of the business, the conditions for when a business must be formally registered with the government, whether paid domestic workers are included, and whether someone with a secondary informal job (but a main formal job) is counted.
Informality is often less visible in richer countries because stronger enforcement and social protections reduce open informal work, while remaining informal activity is concentrated in hidden forms — such as undeclared pay or misreporting — that are harder to capture in surveys.
To put together this chart, we combined the datasets of national country-reported survey estimates and ILO modeled estimates, and compared the values when both were available for any given country-year. We classified estimates as “agreeing” if the absolute difference was less than 0.1 percentage points. Notice that some countries have no published modeled estimates in some years — for example, Ukraine, Palestine, and Sudan in recent years. This happens when the ILO cannot retrieve national data and when it deems that the modeled results wouldn’t be reliable, such as in periods of conflicts or major disruptions.
China is a notable case: in recent years, national and modeled estimates often differ, or only modeled estimates are available. This reflects the fact that China’s national figures are not available for all years and typically refer only to urban areas, whereas the ILO’s modeled estimates aim to produce a consistent national series that includes both urban and rural areas.
The ILO reports in this overview document that they estimate many different versions (specifications) of the models, and select the best performing ones via a “cross-validation method”: repeatedly training models on random parts of the data and selecting those that best predict missing values and produce more stable results. However, the public ILO documentation doesn’t list the exact variables used to model different indicators (only that they may vary), nor the precise rules for when modeled estimates are based on a country’s own history versus information from similar countries. For some indicators (such as labor force participation), the ILO notes that it groups countries by “broad economic similarity and geographic proximity” (p.5), but we could not find more details than that.
You can read more in: ILO Modelled Estimates. Methodological overview. (2025). ILO Department of Statistics. Available at: https://ilostat.ilo.org/methods/concepts-and-definitions/ilo-modelled-estimates/
Read more about other changes in this ILO report.
A description of the “microdata processing” steps is provided in this ILO document.
For some countries, the OECD compiles and publishes these figures in its Data Explorer.
Cite this work
Our articles and data visualizations rely on work from many different people and organizations. When citing this topic page, please also cite the underlying data sources. This topic page can be cited as:
Bertha Rohenkohl, Pablo Arriagada, and Esteban Ortiz-Ospina (2026) - “Work and Employment” Published online at OurWorldinData.org. Retrieved from: 'https://data-archive-fasttrack-step.owid.pages.dev/work-employment' [Online Resource]BibTeX citation
@article{owid-work-employment,
    author = {Bertha Rohenkohl and Pablo Arriagada and Esteban Ortiz-Ospina},
    title = {Work and Employment},
    journal = {Our World in Data},
    year = {2026},
    note = {https://data-archive-fasttrack-step.owid.pages.dev/work-employment}
}
Reuse this work freely
All visualizations, data, and code produced by Our World in Data are completely open access under the Creative Commons BY license. You have the permission to use, distribute, and reproduce these in any medium, provided the source and authors are credited.
The data produced by third parties and made available by Our World in Data is subject to the license terms from the original third-party authors. We will always indicate the original source of the data in our documentation, so you should always check the license of any such third-party data before use and redistribution.
All of our charts can be embedded in any site.